简介
玩鸡玩上瘾了,买了台大宽带流量计费的VPS,54CNY。几十块钱一个月可能对别人来说洒洒水的事情,但对我来说,要是能白嫖那多好😁;故而搭建了nps、frp、rustdesk等东西挂上了闲鱼🐟,极其廉价,到了马云流泪,化腾崩溃的地步。
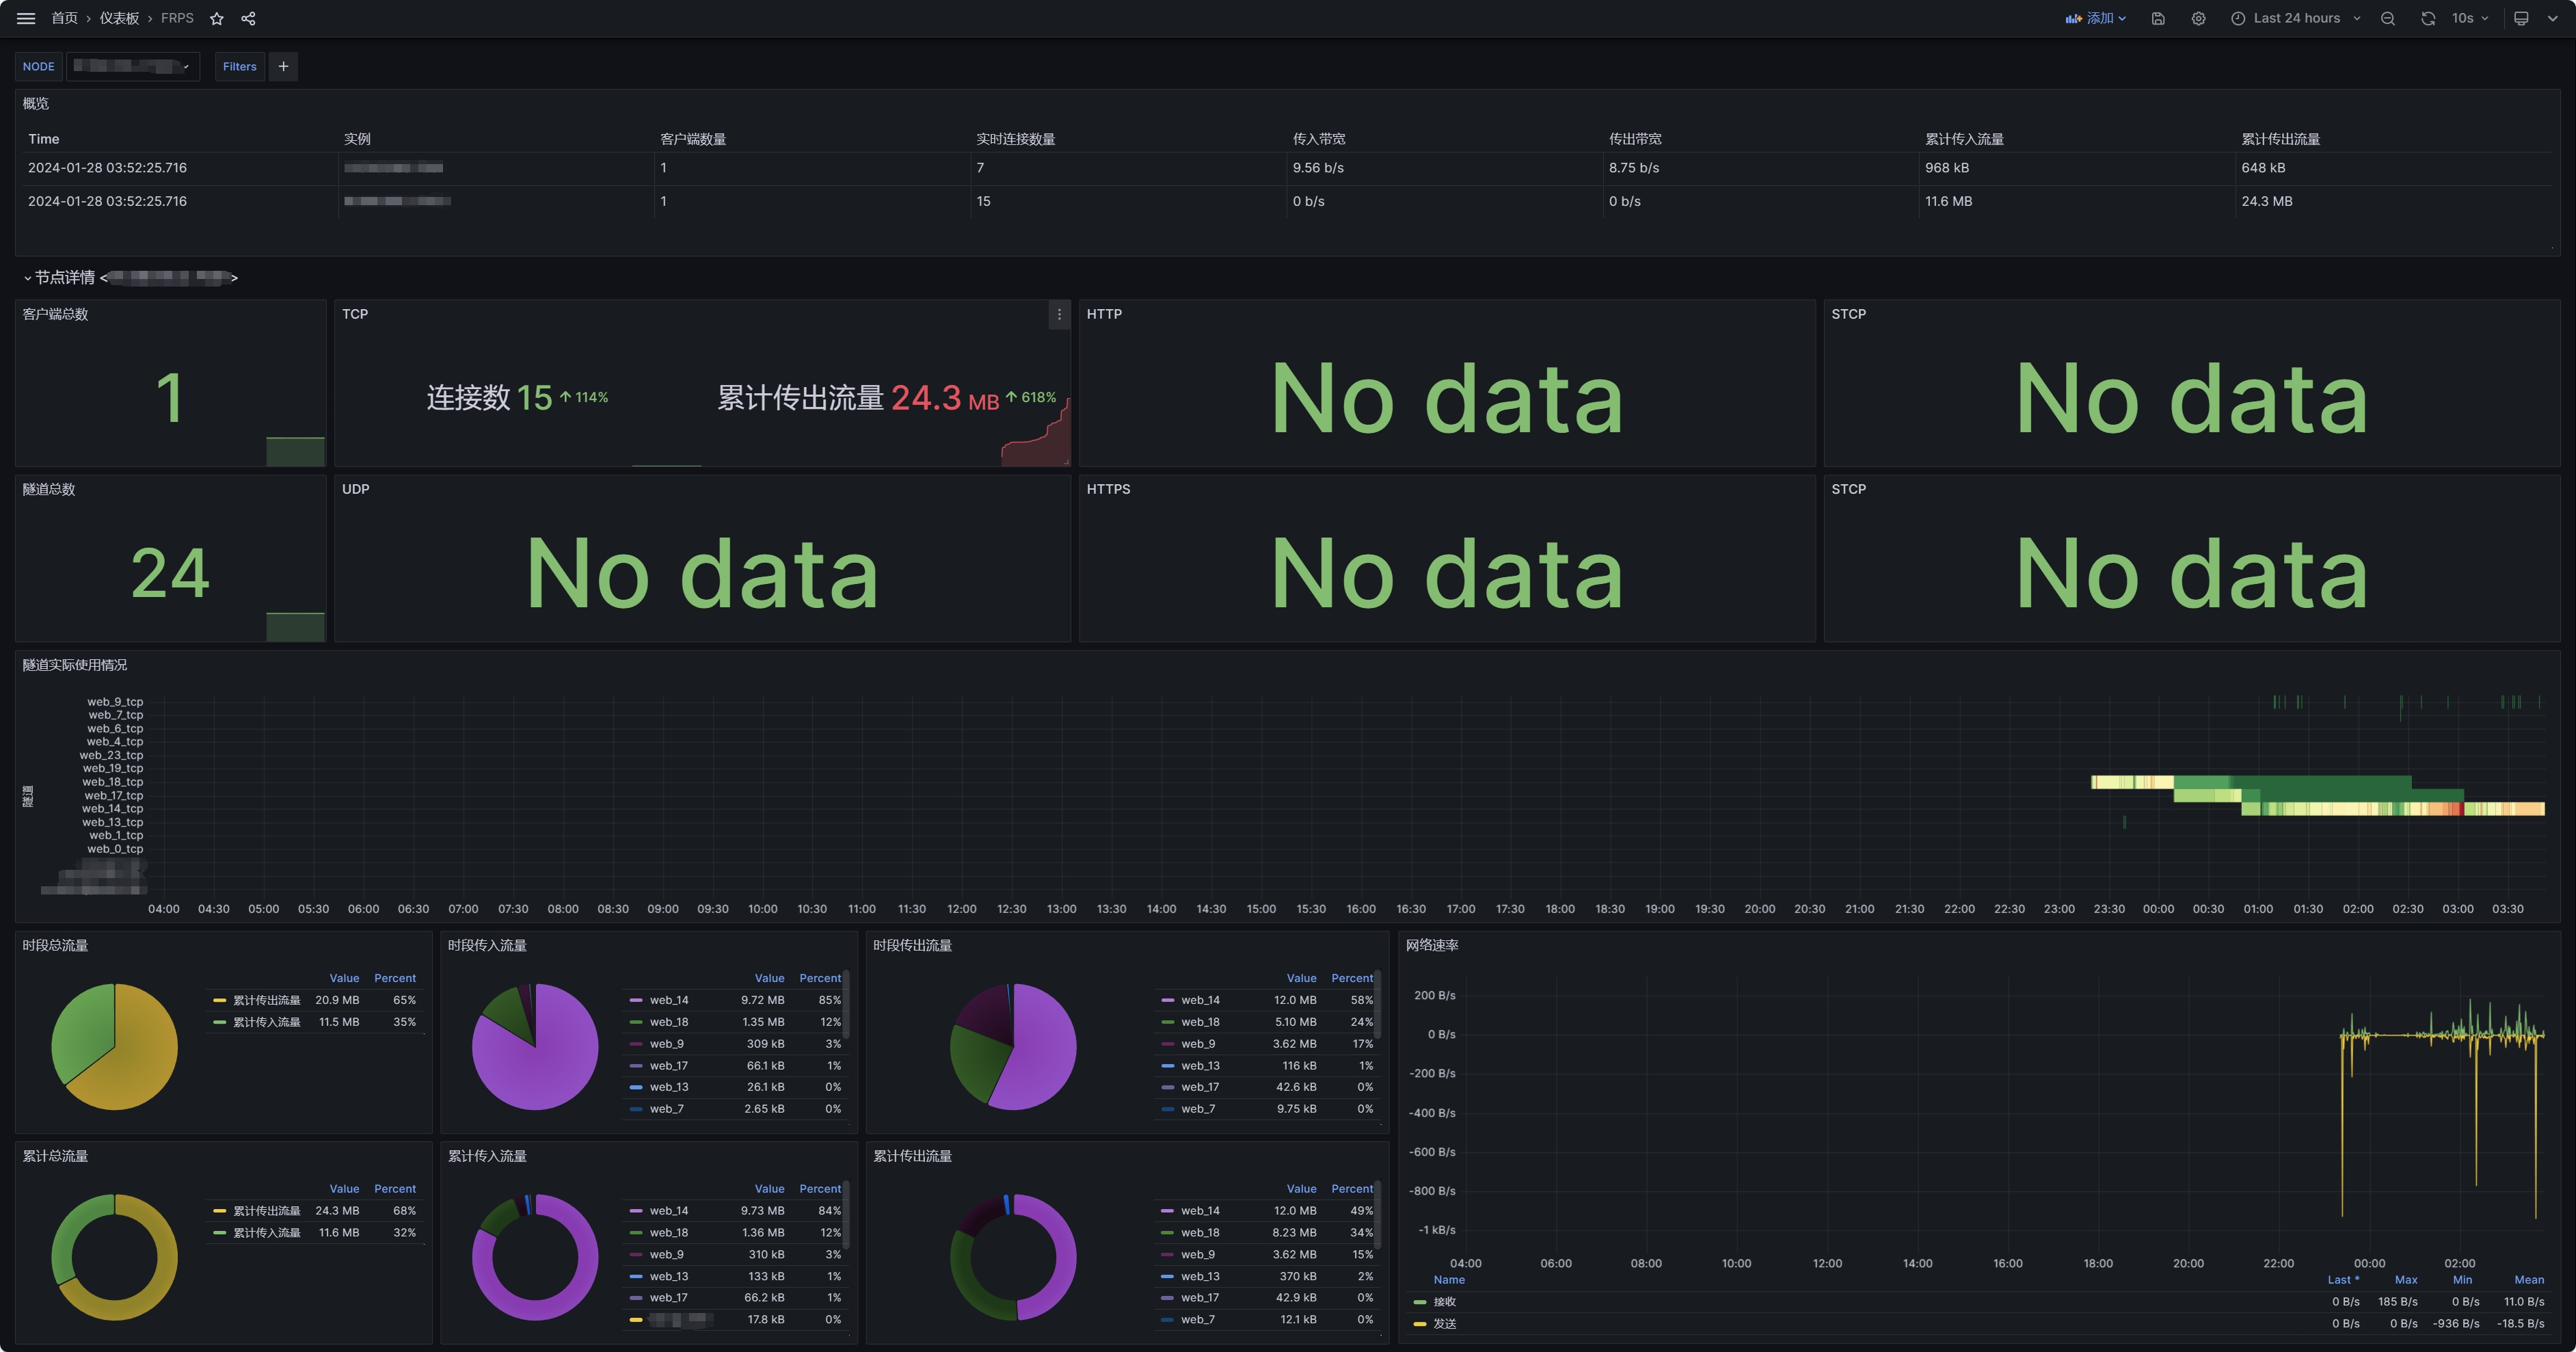
但Frp、Rustdesk并没有流量限制功能,我很遗憾;但Frp提供了 Prometheus 监控接口,又找到了分享一个用于 frps 的 Grafana 的仪表盘 · Issue #3961 · fatedier/frp (github.com),一切都顺理成章,现成的,开始折腾吧。
Prometheus
小插曲,本来直接用阿里云的Prometheus、Grafana的,不幸的是,我的ECS服务器过期了,折腾了几个小时才发现,那就只能自建了。
下载 Prometheus 后,解压缩到目录。
tar xvfz prometheus-*.tar.gz cd prometheus-*- 在目录中找到该文件
prometheus.yml 修改 Prometheus 的配置文件,监控Frp接口
scrape_configs:
- job_name: frps
  honor_timestamps: false
  honor_labels: false
  scrape_interval: 15s
  scheme: http
  basic_auth:
    username: "admin"
    password: "admin"
  metrics_path: /metrics
  static_configs:
  - targets:
    - 127.0.0.1:7500
  scrape_timeout: 15s
将指标发送到托管的 Grafana 实例,这里使用的是grafana.com提供的实例。
remote_write: - url: <https://your-remote-write-endpoint> basic_auth: username: <your user name> password: <Your Grafana.com API Key>- 配置Prometheus自启动,指定监听端口,配置tls与http auth
htpasswd -nBb 账号 密码 #复制输出结果
cat > /opt/prometheus/web-config.yml << OO
tls_server_config:
  cert_file: #tls证书
  key_file: #tls密钥

basic_auth_users:
  # htpasswd结果 用户名:`空格`密码
OO

cat > /etc/systemd/system/prometheus.service << OO
[Unit]
Description=Prometheus

[Service]
ExecStart=/opt/prometheus/prometheus  --config.file=/opt/prometheus/prometheus.yml  --web.listen-address=:19999 --web.config.file=/opt/prometheus/web-config.yml

[Install]
WantedBy=multi-user.target
OO
systemctl daemon-reload
systemctl enable --now prometheus
Grafana
- 效果

grafana.com提供的实例地区多,很好用,但就是但是后来才发现只能储存14天的指标,自建吧……
待续未完……